HeadsUP!

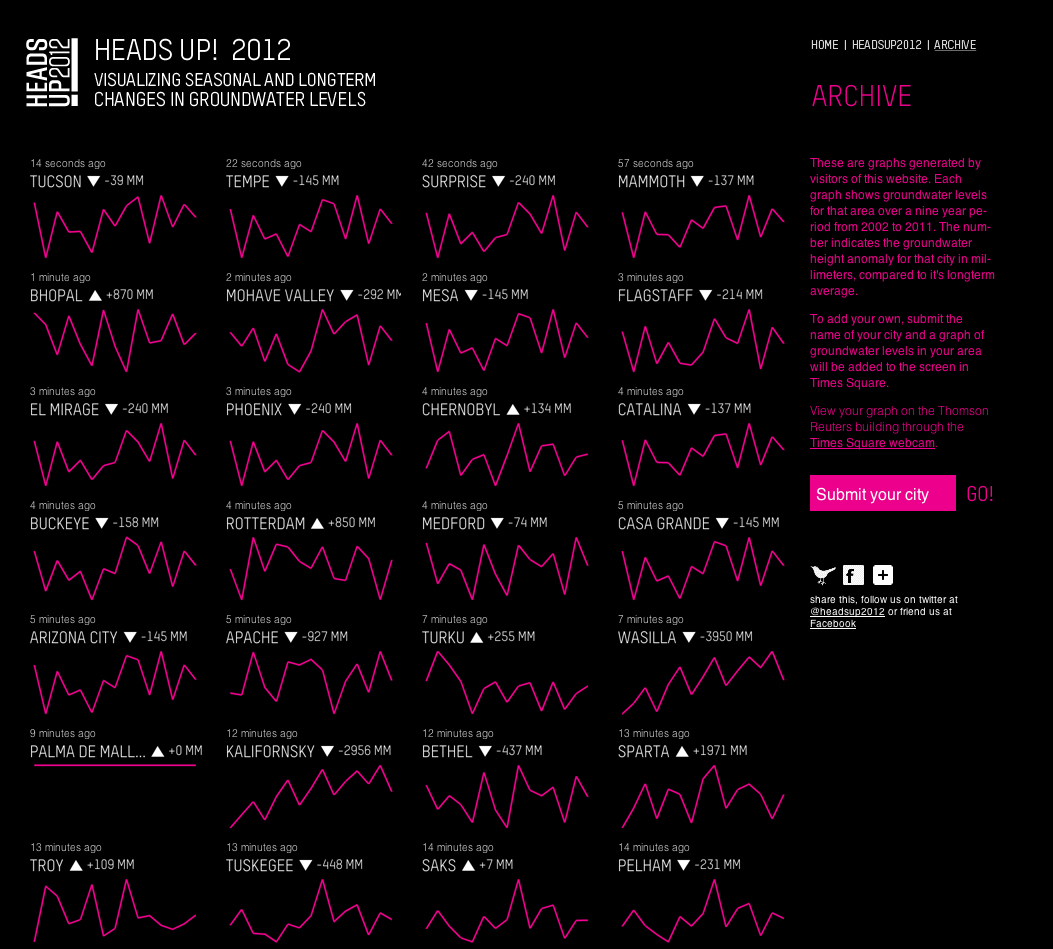
HeadsUP! 2012
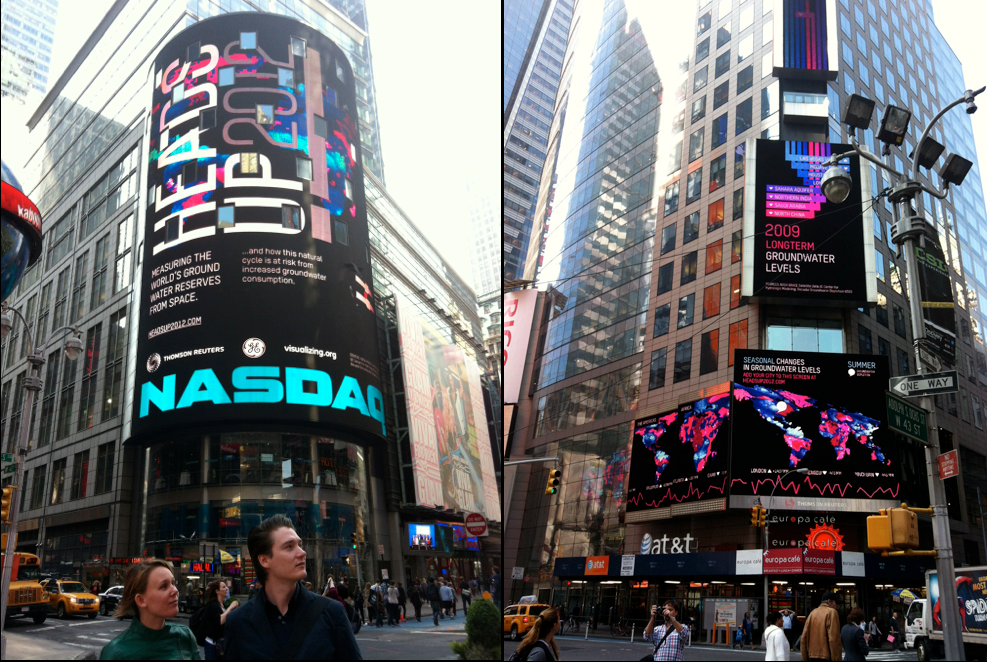
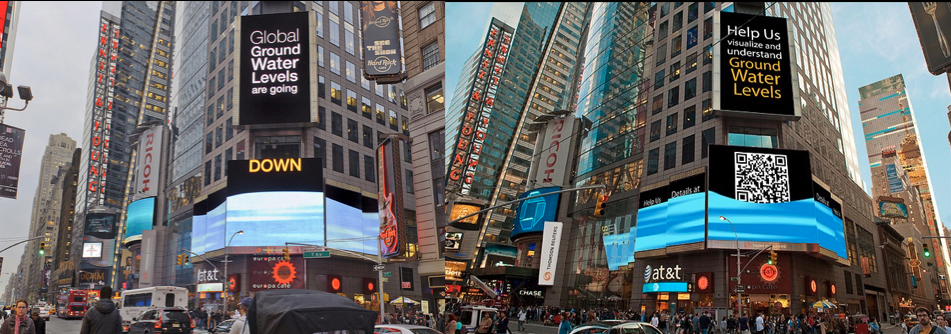
NASDAQ Building Times Square NYC
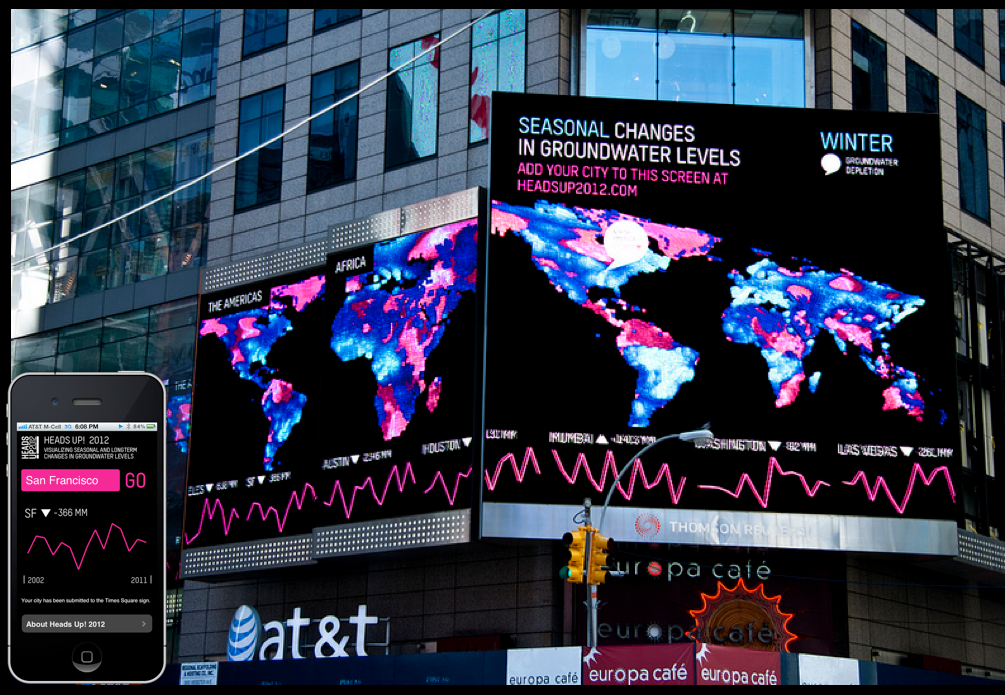
Data Visualization of Global Groundwater on Times Square Digital Signboards, 2012
Design Competition Winner: Richard Vijgen
Project Documentation: HeadsUP2012.com
HeadsUP! was founded in 2010 to challenge designers to apply data visualization to global issues. The competition was announced at PICNIC Amsterdam; Thomson-Reuters provided time on their TS2 digital signboards in Times Square; Visualizing.org provided the platform to host the data and competition.
GRACE Satellite data provided by UCI Professor Jay Famiglietti at JPL/NASA; Decadal Well Data was provided by Leonard Konikow, USGS. The winning animation, by interactive designer Richard Vijgen, was displayed across 19,000 square feet of digital signboard, four times an hour for four months, from March, 22, 2012 through August of that year.
HeadsUP! Times Square 2012 from pweil studio on Vimeo.
HeadsUP! Advisors:
Steve Hayden, CCO Ogilvy & Mather Worldwide; Dale Herigstad, CCO Possible Worldwide; Bruce Mau, Bruce Mau Design; Alex McDowell 5D Institute; Jay Famiglietti, UC Center Hydrologic Modeling, Sylvia Lee, Skoll Foundation for Global Threats; Dr. Anthony Leiserowitz, Yale Project on Climate Change Communication; Dr. Michael Oppenheimer, Professor of Geosciences and International Affairs, Princeton University; Mark Hansen, Professor of Statistics, UCLA, Martin Wattenberg, Google Big Picture; Dr. Carlo Buontempo, Senior Climate Scientist, MET Office UK (note: affiliations reflect 2012)
Invitation to HeadsUP! Global Design Competition and access to datasets posted on Thomson-Reuters signboards, Times Square October 2011